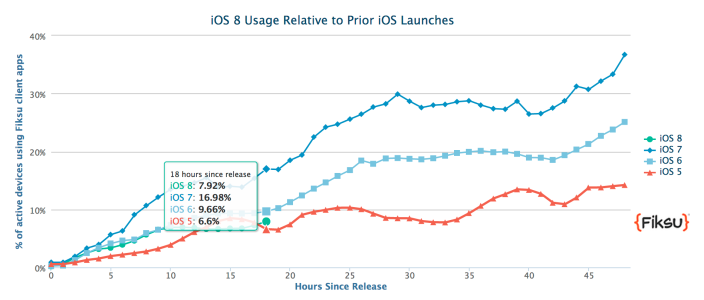
Over 60% of 9to5Mac readers are on iOS 8 following yesterday’s public release, but that’s not surprisingly representative of all users. In fact, adoption of iOS 8 this year seems to be lagging further behind previous releases, especially last year’s record setting adoption rate for iOS 7. A quick look at the various advertisers and research firms tracking adoption through apps and device usage on their platforms shows iOS 8 is sitting at around half of what iOS 7 had during the same time period. Expand Expanding Close
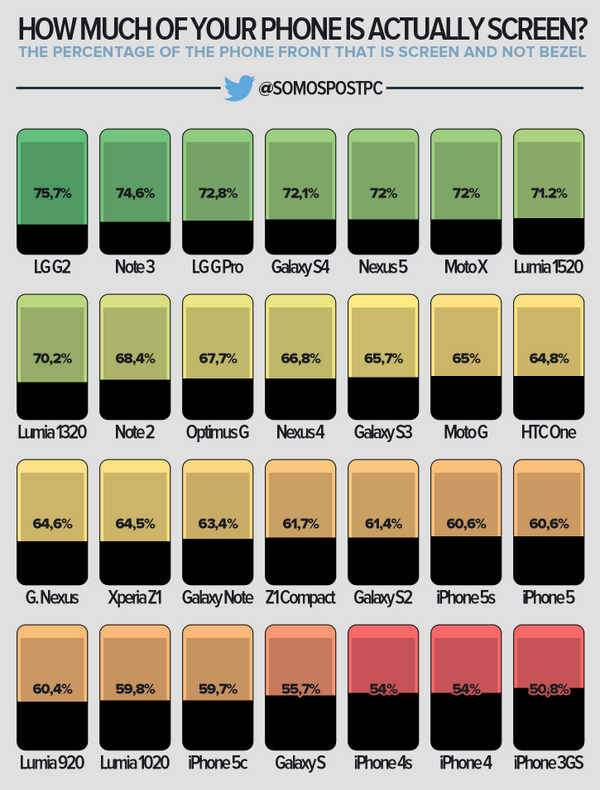
Have you ever wondered how much of your phone is actually screen? That is, how much of your phone is usable screen real estate in relation to the overall size the device? The chart above from @somospostpc shows you exactly that for some of the most popular devices from LG, Samsung, HTC, Nokia, Motorola and Apple. The LG G2 comes out on top at 75.7% display compared to 60% and below for the current lineup of iPhones.
Apple is at a disadvantage because of the home button/Touch ID rather than the on screen buttons of Android. Also, the iPhone is symmetric meaning the same big bezel on the bottom is needed at the top so that the screen sits in the exact middle of the phone.
If the rumors are true, we could start to see manufacturers try to increase screen real estate by eliminating even more of the bezel. In Apple’s case, that would likely require eliminating the home button and moving the TouchID sensor under the glass.
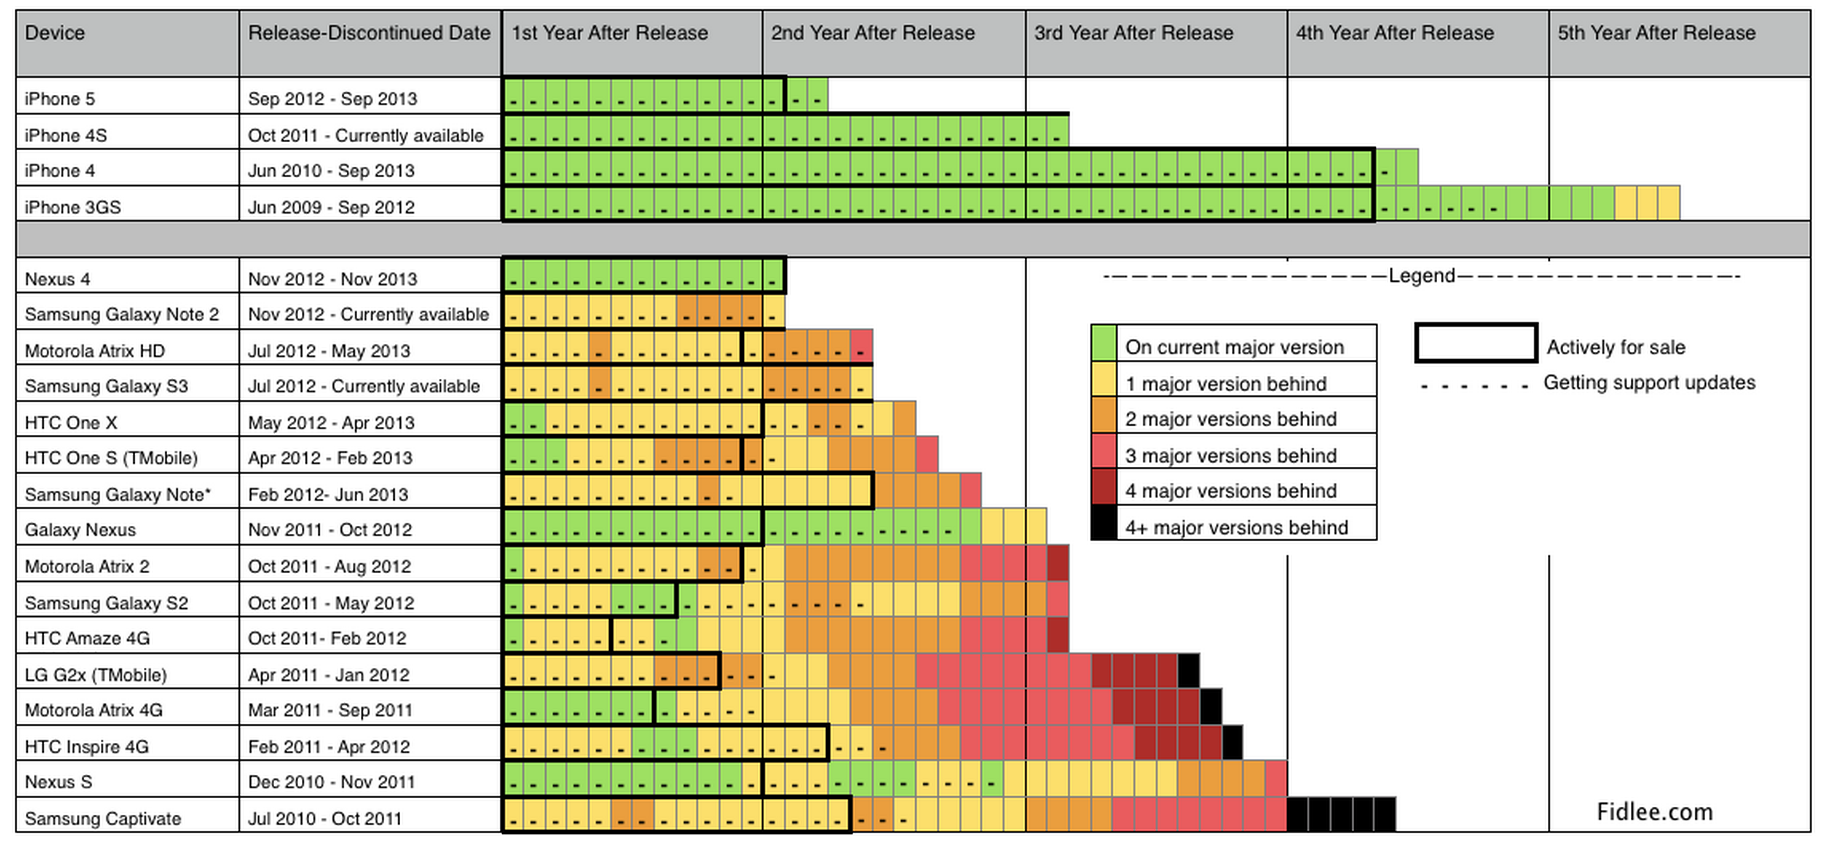
We hear a lot about adoption of iOS updates vs the fragmentation that Android users are forced to deal with, but just how far behind are the top Android devices compared to iPhone when it comes to getting support? To answer that question, Fidlee.com has updated a chart that it first put together a couple years back in order to see if Android has become any better in recent years. It hasn’t.
In the chart above we see that many once flagship Android devices— the Galaxy Note 2, Galaxy S3, LG G2 etc— have still not received the latest Android 4.4 KitKat update. Most of the devices on the list have been an upgrade or two behind since launch or not long after. In comparison, only the iPhone 3GS fives years after its release doesn’t support iOS 7. We also get a look at how much longer Apple devices generally stay available for sale and continue receiving support– nearly twice as long as Android in most cases.
Not only did Apple claim iOS 7 was “the fastest software upgrade in history” with more than 200 million devices installing the OS less than a week after launch, but analytics firms also noticed adoption was much higher than previous releases. Currently iOS 7 sits at about 77% of users, according to the latest data from Fiksu’s iOS Usage Monitor. While the chart above is only for devices released last year, things aren’t much better for newer Android devices. In comparison to iOS 7 adoption, Google reports that its latest release, Android 4.4 KitKat, is at just 1.1% weeks into launch. The previous release, Android 4.3, is at just 4.2%, while the majority of users remain on Android 4.1 Jelly Bean first released in July 2012.
A couple more charts below from Fidlee showing just how bad things are on Android: Expand Expanding Close
Nielsen is out today with the results of a new study to gauge interest in buying mobile devices and gaming consoles leading into the holidays in the United States. Much like last year, Apple’s iOS devices remain among the highest ranking with kids ages 6 to 12, while the iPhone and iPad also get top spots in the 13+ category.
As you can see from Nielsen’s charts above and below, the full-sized, 9.7-inch iPad gets the top spot in both categories with 48 percent in the 6 to 12 age group (up from 44 percent last year) and 21 percent in the 13+ group. As for the iPad mini, it was less desirable among kids, coming in at 36 percent for kids ages 6 to 12, just behind the Nintendo Wii U and iPod touch in second and third positions.
Approximately half the children surveyed expressed interest in the full-sized iPad (up from 44% last year), and 36 percent in the new iPad Mini. The iPod Touch and iPhone are also coveted devices among these young consumers (36% and 33%, respectively). Kids are also likely to ask for dedicated gaming hardware this holiday, with 39 percent excited to own Nintendo’s just-released console offering, Wii U, and 29 percent indicating they want a device from that company’s portable DS family.
While game consoles dominated the top spots when Apple devices didn’t, the 13+ age group showed interest in non-iPad tablets with 18 percent of the group interested in buying over the next 6 months. Mobile devices from Microsoft, Amazon, and Samsung didn’t do as well, coming in at under 20 percent for both groups and 6 percent and under for the Surface: Expand Expanding Close
The Loop pointed us to this iOS support matrix (Autumn 2012 edition) posted by app developer Empirical Magic. Definitely a useful resource for developers, the chart shows the number of devices running certain versions of iOS, and makes recommendations for dropping support in future updates.
It’s no secret patent-related legal disputes have become the subject of most media coverage lately…Whether it’s Apple halting sales of Samsung’s tablets, HTC going after Apple, or Google snatching up Motorola to beef up their patent portfolio, it’s clear the company with the most patents will have an advantage over others in the legal proceedings that we’re bound to continue encountering down the road. This is why we’re intrigued by the graphic above (via GigaOM)from mobile analyst Chetan Sharma charting the number of issued patents (in the US and Europe) between 1993 and 2011.
While these estimates of mobile communications related patents don’t take the quality of patents into account (which is obviously a huge factor in determining their long-term value), you can see from the breakdown below that Nokia and Samsung top the list, with the other expected players including IBM, Microsoft, Sony, Motorola, and Intel following.
Noticeably far down the list is Apple, the one company who seems to have had more success than others fighting patent-related issues recently. Again, these numbers in no way represent the quality of patents and the ability for companies to protect their IPs in the courtroom… which is also a good indication that perhaps we should be looking more closely at the quality of patents rather than the sheer number.
Recently patent expert Florian Mueller took to Twitter following the Google/Motorola acquisition saying he“would caution everyone against overestimating the strength of Motorola Mobility’s patent portfolio,” he continued, “Apple and Microsoft sued Motorola Mobility anyway”. Remember kids… all patents aren’t created equally. Expand Expanding Close


